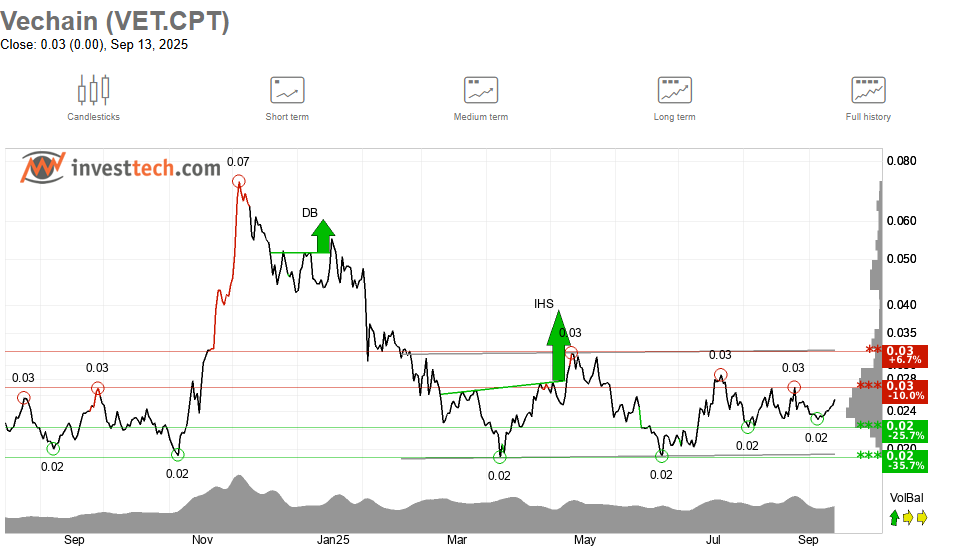
- VET hovers near $0.03 resistance, with potential targets stretching up to $0.056 if confirmed.
- The token trades between $0.02 support and $0.035 resistance, reflecting consolidation and indecision.
- Holding $0.02 keeps upside intact, but a breakdown risks sharper declines and renewed bearish pressure.
VeChain (VET) is showing signs of an important technical setup as the price hovers near decisive chart levels. The token trades around $0.03, facing strong resistance that has repeatedly halted gains in recent months. Market indicators suggest both breakout potential and the possibility of renewed downside pressure if key levels fail.
VeChain is currently testing the upper border of a descending triangle while crossing above the 50-day moving average. This move signals a possible breakout from a consolidation phase that has contained price action for several months. If the breakout sustains, price targets extend toward $0.027, $0.034, $0.040, and potentially $0.056.
However, confirmation remains essential for any sustained advance. A successful retest of the breakout zone could validate momentum toward higher resistance points. Without such confirmation, VET may slip back into the triangle, limiting upside in the short term.
Technical indicators provide additional context for the setup. The RSI shows increasing relative strength, pointing to renewed buying activity. Yet, stronger volume is required to validate a decisive breakout beyond long-standing resistance levels.
Medium-Term Range and Resistance
The medium-term chart highlights VET trading within a defined range between $0.02 support and $0.035 resistance. Resistance around $0.03 has repeatedly capped rallies, reflecting ongoing difficulty in sustaining upward momentum. Breaking through this ceiling will be necessary for establishing a stronger uptrend.

Historical price action adds perspective to current levels. Earlier in the year, a double bottom pattern provided temporary relief, followed by an inverse head and shoulders breakout near May. Both signals pushed the price upward, but gains eventually faded as resistance zones proved difficult to overcome.
VET continues to lack consistent accumulation, with volumes spiking only during speculative moves. This suggests traders engage in short bursts rather than long-term positioning. Sustained buying pressure will be key to changing the medium-term picture.
Support Levels and Downside Risk
On the downside, $0.02 remains a critical support level. Buyers have repeatedly defended this floor, preventing a deeper correction. However, repeated tests can weaken support, raising the risk of a sharper decline if it fails.
A breakdown below $0.02 could open the path toward lower levels, erasing previous gains. Such a move would shift sentiment toward a bearish outlook. Conversely, holding this level ensures that consolidation remains intact and keeps upward potential alive.
In summary, VeChain stands at an important crossroads. A breakout above $0.035 could open new upside opportunities, while a loss of $0.02 would increase downside risk. Market participants now await confirmation of direction as the token continues to trade within its established range.


